Kubernetes is now the foundation of modern cloud-native platforms — microservices, CI/CD workflows, service meshes, API gateways, and distributed applications all run on it. But the more dynamic and scalable Kubernetes becomes, the more overwhelming its logs get.
Every pod, container, sidecar, and node generates streams of data. Multiply this by autoscaling, rapid deployments, and distributed clusters, and organizations quickly find themselves drowning in logs they can’t efficiently store, analyze, or even route properly.
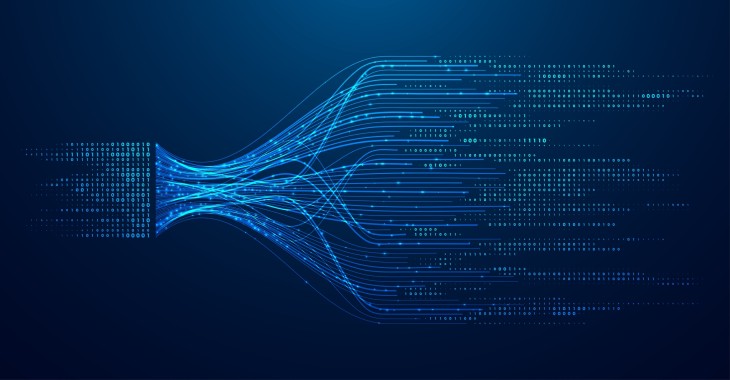
This is exactly where Kron Telemetry Pipeline (Kron TLMP) brings clarity, cost control, and architectural simplicity.
The Kubernetes Logging Problem
-
Explosive Log Volume
A single microservice may generate dozens of log lines per second. A cluster with 150+ microservices, each with multiple pods, quickly turns into millions of events per minute.
Worst part:
Much of this data is repetitive, low-value, or noisy.
-
Operational Complexity
Organizations deploy various collectors — Fluentd, Fluent Bit, Filebeat, Vector, custom sidecars — each with its own configuration, schema, and forwarding logic.
As environments grow, these agents become harder to manage and standardize.
-
Storage & Licensing Costs
Forwarding everything directly into:
- Elasticsearch / OpenSearch
- Splunk
- CloudWatch
- Loki
- SIEMs
…often drives costs dramatically. In some platforms, log ingestion cost becomes higher than compute cost.
-
Siloed Data
Logs, metrics, and traces typically end up in separate systems, making correlation slower and more expensive.
Kubernetes is complex enough — your observability pipeline shouldn’t add more complexity.
How Kron Telemetry Pipeline (Kron TLMP) Fixes Kubernetes Logging
Kron TLMP acts as a unified, intelligent control plane for all observability data. Instead of pushing raw logs into expensive analytics tools, Kron TLMP performs reduction, enrichment, normalization, and routing before logs reach downstream systems.
-
Massive Log Reduction Before Ingestion
Kron TLMP eliminates:
- noisy debug logs
- repetitive error messages
- health-check spam
- container restart loops
- identical log lines emitted per pod
Techniques include aggregation, deduplication, sampling, field trimming, and rule-based filtering.
This results in:
- 50%–90% lower log volume for Kubernetes
- drastically reduced SIEM / Elastic / Cloud logging cost
- smaller storage footprint
- faster search performance
It’s the same principle that reduced a customer’s firewall logs by 93% now applied to Kubernetes workloads. See Reducing Firewall Log Volume by 93% with Kron Telemetry Pipeline in detail.
-
Consistent Normalization Across All Clusters
Kubernetes logs vary significantly depending on:
- runtime (Docker, containerd, CRI-O)
- microservice logging libraries
- app frameworks
Kron TLMP unifies all this into a consistent schema and optionally enriches logs with Kubernetes metadata such as:
- namespace
- deployment
- pod name
- node name
- labels
- container image
This makes downstream searching and correlation dramatically easier.
-
Decoupling Sources From Destinations
One of Kron TLMP’s biggest strengths is that you don’t have to send logs directly from the cluster to expensive analytics platforms.
Kron TLMP receives all logs centrally and routes them to:
- Elastic / OpenSearch
- Data lakes
- Object storage (S3, MinIO)
- Kafka / message queues
- SIEMs (Splunk, QRadar, etc.)
- Custom APIs
So, it is possible to route high-value logs to SIEM and push bulk raw logs to S3 for cheap retention.
This breaks vendor lock-in and gives you architectural flexibility.
-
Intelligent Cost Management & Long-Term Retention
Kubernetes often produces logs that which don’t need indexed but do need retained for compliance or debugging.
Kron TLMP solves this by:
- sending structured, enriched logs to your analytics platform
- removing unnecessary fields and attributes in the logs
- archiving raw logs to cheap storage
- supporting on-demand rehydration when needed
This enables 1–2 years of retention without burning budget.
A Quick Note on Deployment Models
Kron TLMP offers flexibility depending on how Kubernetes environments are structured.
Model 1 — Deploy Kron TLMP Agent Inside Kubernetes
- Runs as DaemonSet
- Processes logs inside the cluster
- Best for high-volume, high-pressure logging environments
- Maximum noise reduction before logs leave the cluster
Model 2 — Use Existing Agents and Forward to Kron TLMP
- No additional agent needed
- Fluentd/Vector/Filebeat send logs directly to Kron TLMP
- Easiest drop-in adoption
- Ideal for teams that already have a mature collector setup
Both models unlock the same core value — log reduction, normalization, enrichment, routing flexibility, and vendor decoupling.
Conclusion
Kubernetes generates enormous amounts of telemetry. Without a specialized pipeline, this data becomes expensive, chaotic, and hard to analyze.
Kron Telemetry Pipeline transforms Kubernetes logging by reducing volume, enriching context, simplifying architecture, and unlocking true multi-destination routing — all while working with any existing logging stack.
Whether you run a single cluster or hundreds, Kron TLMP gives you the observability control plane Kubernetes always needed but never had.
*Written by Cihangir Koca. He is a Solution Architect at Kron.