A Tier 1 mobile operator operates at massive scale, where firewalls in data centers and IT systems continuously generate high-volume telemetry streams. In this environment, Fortigate and Palo Alto firewalls were producing millions of log events per day, all forwarded directly into Splunk for analysis.
This unoptimized ingestion pattern introduced several challenges:
- Storage overhead from redundant log records
- License cost escalation from excessive Splunk event counts
- Performance degradation in Splunk queries and dashboards
- Operational inefficiency in Security Operations Center (SOC) workflows
A large portion of these logs were near-duplicates: repeated flows between the same source and destination, with only counters (bytesIn/bytesOut) incrementing. Without preprocessing, the operator had to either absorb the cost or sacrifice visibility.
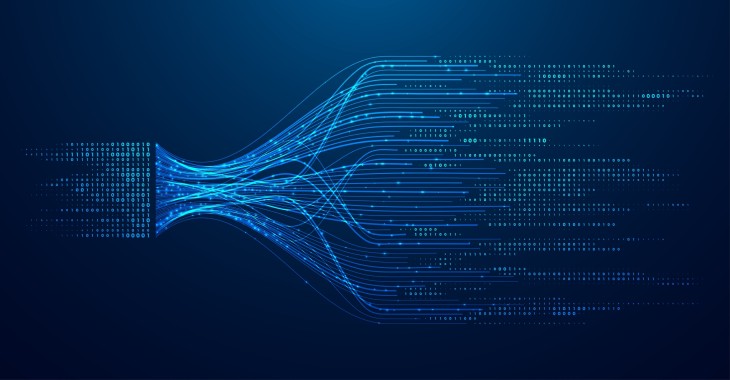
To address this, the operator deployed Kron Telemetry Pipeline as an intermediate processing layer between firewalls and Splunk.
Log Normalization and Aggregation
Kron Telemetry Pipeline ingests raw syslog messages from Fortigate and Palo Alto firewalls and parses them into structured records. Common fields extracted include:
- srcip
- dstip
- dstport
- action
- traffic counters (bytesIn, bytesOut)
Once normalized, it applies an aggregation. Events are grouped on a set of key dimensions:
- deviceVendor
- deviceProduct
- deviceEventClassId
- sourceAddress
- destinationAddress
- destinationPort
- action
Events matching these keys within the same time window are consolidated into a single record. During aggregation:
- bytesIn and bytesOut counters are summed
- A new field aggregationCount is appended to indicate the number of collapsed events
The enriched records are then re-emitted via syslog in a Fortigate-compatible format, ensuring downstream Splunk indexers remain unaffected.
Example: Six Events → Two
Consider six raw firewall traffic logs:
- Five events share identical key fields (same source, destination, port, and action).
- One event differs.
After aggregation:
- The five duplicate-like events collapse into one enriched record with summed counters and an aggregationCount of 5.
- The unmatched event remains unchanged but still receives a count field.
Thus, six records are reduced to two without data loss in critical dimensions.
At scale, this deduplication process applies continuously across all firewall clusters, dramatically reducing Splunk ingestion volume.
Deployment and Performance
Kron Telemetry Pipeline was deployed as a Kubernetes-native application with the following characteristics:
- Containerized microservices: ingestion, parsing, aggregation, and emission stages decoupled for resilience.
- Horizontal Pod Autoscaling (HPA): pod count automatically scales with log throughput (CPU/memory utilization).
- Buffering and backpressure control: prevents packet loss during network or Splunk ingestion slowdowns.
- Aggregation window tuning: 30 seconds was chosen to balance near real-time visibility with high compression ratios.
- Throughput: >500k events per second per cluster sustained.
Key outcomes observed:
- ~93% reduction in log volume in 30 second aggregation interval
- Improved Splunk performance: faster queries, stable dashboards under load
- SOC efficiency gains: reduced noise, improved signal-to-noise ratio for analysts
- Cost optimization: significant reduction in storage and Splunk license usage
This solution not only reduced infrastructure overhead but also stabilized real-time monitoring, enabling SOC teams to maintain visibility during peak network activity.
Conclusion
For Tier 1 operators, the challenge is not log retention but log manageability. By introducing a preprocessing and aggregation stage with Kron Telemetry Pipeline, redundant Fortigate firewall events were collapsed while preserving analytical fidelity.
The result: full visibility at a fraction of the cost, with enriched events that maintain operational integrity in Splunk.
As log volumes continue to grow, pipeline-driven optimizations are no longer optional—they are mandatory for sustainable observability and SIEM infrastructures at carrier scale.
Ready to learn more about how a Kron Telemetry Pipeline can transform your log management? Discover Kron Telemetry Pipeline to see how it can help your IT team stay afloat in the sea of data.