Observability Pipeline 101: Concepts and Terminology
May 23, 2023
/
Kron
Observability is a crucial concept in modern software development. It involves monitoring and understanding the behavior of complex systems, including software applications and infrastructure. The practice of observability enables teams to promptly detect and resolve problems, leading to better system performance and dependability. One of the key components of observability is the observability pipeline. In this article, we'll explore the basic concepts of observability pipelines and the related terminology.
What is an Observability Pipeline?
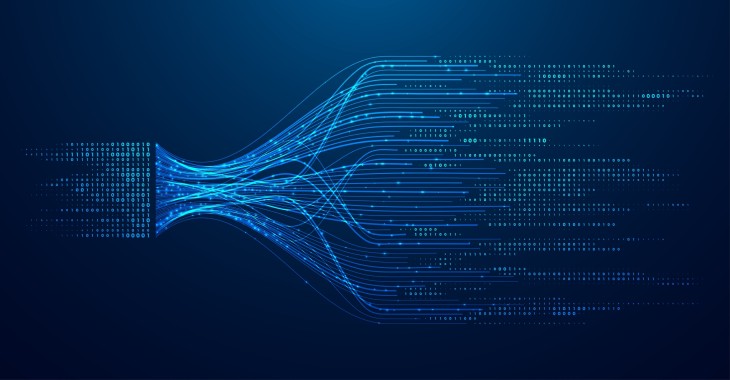
An observability pipeline is a data management tool that enable teams to collect, process, and analyze data from various sources, including logs, metrics, and traces. The pipeline allows teams to take control of streaming data and process it according to the needs at destinations.
The observability pipeline typically consists of three main stages: data collection, data processing, and data sink. Let's take a closer look at each stage.
Data Collection
Data collection is the first stage of the observability pipeline. In this stage, data is collected from different sources, including application logs, system metrics, and distributed tracing. The data is then aggregated and routed to destinations, such as a datalakes or analytics platforms like Splunk or AWS S3. Logs are textual records of events generated by applications and systems. They provide a detailed record of system activity, including errors, warnings, and informational messages. Metrics are numerical measurements that describe system behavior. They can be collected using tools such as Prometheus or InfluxDB. Metrics provide a high-level view of system performance, including resource utilization and request latency.
Distributed tracing provides a detailed view of how requests flow through a distributed system. Traces are generated by instrumenting code with tracing libraries, such as OpenTelemetry or Jaeger. Traces can be collected and analyzed using distributed tracing platforms such as Lightstep or Zipkin.
Data Processing
The second stage of the observability pipeline is data processing. In this stage, data is transformed and enriched to make it more useful for analysis. Data processing can include filtering, aggregation, normalization, and enrichment.
Filtering involves removing irrelevant data from the pipeline. For example, you may want to filter out logs that are not valuable to a particular destinations like SIEM tools or analytical platforms.
Aggregation involves combining data from multiple sources to provide a more complete picture of system behavior. For example, you may want to aggregate metrics from multiple servers to identify trends or patterns.
Normalization involves standardizing data formats to enable easier analysis. For example, you may want to normalize timestamp formats or convert log levels to a common standard.
Enrichment involves adding additional context to data based on csv lookups or filters to enable deeper analysis. For example, you may want to enrich log data with user and session information to better understand user behavior.
Data Analysis
The third and final destination of the observability pipeline is data analysis. In this stage, data is analyzed to gain insights into system behavior and identify issues. Data analysis can include visualization, anomaly detection, and alerting.
Visualization involves presenting data in a graphical format to enable easier analysis. Visualization tools such as Grafana, Kibana, and Tableau can be used to create charts, graphs, and dashboards that provide a high-level view of system behavior.
Anomaly detection involves identifying unusual patterns or behaviors in the data. Machine learning algorithms can be used to automatically detect anomalies, or rules-based systems can be used to flag abnormal behavior.
Alerting involves notifying teams when issues are detected. Alerts can be sent via email, SMS, or Slack, and can be customized based on severity or other criteria.
Observability Pipeline is becoming crucial element to help log management platforms and analytical platforms to manage growing data.
Observability Pipeline Terminology
Now that we've explored the basic concepts of the Observability Pipeline Terminology
Telemetry
Telemetry is a general term that refers to the process of collecting and transmitting data from a remote source. In the context of observability, telemetry refers to the data that is collected from various sources, including metrics, logs, and traces. Telemetry enables teams to gain a comprehensive view of system behavior and identify issues quickly.
Metrics
Metrics are numerical measurements that describe system behavior. They are typically collected at regular intervals and can be used to monitor system performance and resource utilization. Metrics can include CPU usage, memory usage, request latency, and error rates. Metrics are often used to create dashboards and alerts that enable teams to quickly identify and resolve issues.
Logs
Logs are textual records of events generated by applications and systems. They provide a detailed record of system activity, including errors, warnings, and informational messages. Logs can be used to diagnose issues, debug code, and analyze user behavior. Logs can be collected using log aggregation tools such as Fluentd, Logstash, or Splunk.
Traces
Traces provide a detailed view of how requests flow through a distributed system. Traces are generated by instrumenting code with tracing libraries, such as OpenTelemetry or Jaeger. Traces can be used to identify bottlenecks, diagnose issues, and analyze user behavior. Traces can be collected and analyzed using distributed tracing platforms such as Lightstep or Zipkin.
Structured Data
Structured data refers to data that is organized in a specific format or schema. Structured data is often used to enable easier analysis and processing. In the context of observability, structured data can be used to enable easier log analysis, query performance data, and identify trends or patterns. Examples of structured data formats include JSON, XML, and CSV.
Instrumentation
Instrumentation refers to the process of adding code to an application or system to enable observability. Instrumentation can include adding logging statements, instrumenting code with tracing libraries, or adding metrics collection. Instrumentation is critical for enabling observability, as it allows teams to collect the data they need to gain insights into system behavior and diagnose issues quickly.
Enable Observability Practices with Kron's Data Stream Processing
In conclusion, observability pipelines are crucial for enabling organizations to take control of their streaming data. By collecting and analyzing data from various sources such as metrics, logs, and traces, teams can identify trends, patterns, and potential bottlenecks. Both structured & semi-structured data and instrumentation play a critical role in the observability pipeline by enabling efficient and effective collection and analysis of data.
Kron is one of the leading companies that provides a powerful and flexible data stream processing solution to empower observability tools. Kron's Data Stream Processing (DSP) solution enables organizations to process and analyze large amounts of data in real-time, providing instant insights into system behavior. With features such as real-time processing, fault tolerance, and scalability, Kron's Data Stream Processing solution can help organizations implement observability practices and gain deep insights into their systems' performance and reliability.
Overall, the use of observability pipelines and solutions such as Kron's Data Stream Processing can greatly benefit organizations by improving data management process for all kind of stream-based data for all platforms like on-premise or public-cloud.
If you're interested in implementing observability practices in your organization and want to learn more about Kron's Data Stream Processing solution, feel free to contact us to schedule a demo and learn how Kron's DSP can help you gain real-time insights into your system behavior and improve your overall system performance and reliability.

